Minhas anotações sobre Tableau. Tem bastante coisa antiga mas como de vez em quando volto aqui pra ver algum cálculo ou parâmetro, pode ser útil.
• Tips and tricks
(inclui gráficos de barras em tooltips, diagrama de relações, )
http://www.tableausoftware.com/about/blog/2014/9/tc14-recap-rapid-fire-tips-tricks-33197
• Configurar Unidades (vírgula, divisor de milhar)
Edit > Locale > Portuguese (Brazil)
Por padrão, o Tableau identifica o formato do sistema operacional. Ajuste em Painel de Controle > Opções regionais e de idioma > Português Brasil.
• Adicionar sinal de + e - na frente do número
Propriedades padrão > Formato do número > Personalizado
Inserir: "+"#,##0.00%;"-"#,##0.00%;
https://community.tableau.com/thread/125696
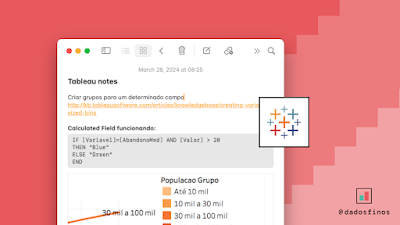
• Criar grupos para um determinado campo
http://kb.tableausoftware.com/articles/knowledgebase/creating-variable-sized-bins
• Resolver overlapping points
http://www.datadrivenconsulting.com/2011/04/counting-overlapping-marks-in-tableau/
• Mostrar o número de locais filtrados? (count/sum marks)
http://community.tableausoftware.com/thread/110308?start=0&tstart=0
http://drawingwithnumbers.artisart.org/creating-a-dynamic-parameter-with-a-tableau-data-blend/
http://www.clearlyandsimply.com/clearly_and_simply/2011/03/tableau-quick-tip-1-the-summary-card.html
• BASICS
Best Practices for Designing Vizes and Dashboards
http://kb.tableausoftware.com/articles/knowledgebase/best-practices-designing-vizes-and-dashboards
Apresentação sobre o tableu em artigo de Infovis
http://rogerking.me/wp-content/uploads/2012/01/infovis-paper-showme-vfinal1.pdf
Tableau for the iPad
http://www.interworks.com/blogs/eshiarla/2012/02/10/designing-tableau-visualizations-ipad
Quick start guide
http://www.tableausoftware.com/support/manuals/quickstart
• DADOS E TABELAS
Preparando os dados para o Tableau
http://www.tableausoftware.com/support/knowledge-base/preparing-excel-files-analysis
Excel Reshaping Add-in
http://www.tableausoftware.com/support/forum/topic/using-excel-crosstab-data-source
http://kb.tableausoftware.com/articles/knowledgebase/addin-reshaping-data-excel#2010
http://vizwiz.blogspot.com.br/2012/03/invaluable-tool-tableau-reshaper.html
http://www.tableausoftware.com/about/blog/2012/03/reshaping-data-made-easy-16353
Excel Reshaper Add-in (baixar de outras fontes)
https://www.dropbox.com/s/86to6zfrmlap6hv/tableau_data_tool_reshape_excel.zip
Formato dos dados / Reshaping Data
[Queria agrupar as Measures, mas parece que o jeito mais correto do banco de dados seria "Municipio, Data, Categoria, Valor"]
http://www.tableausoftware.com/support/forum/topic/group-measures
http://www.tableausoftware.com/support/forum/topic/can-i-group-measures
Juntar tabelas (join, blend, ...)
http://www.tableausoftware.com/support/knowledge-base/join-vs-relationship-60
[relacionar (linkando) tabelas para visualizações com muitas variáveis é um porre. melhor juntar os dados em um só xls]
No caso de querer insistir/precisar linkar varios xls, pode ser útil: http://www.tableausoftware.com/support/knowledge-base/asterisk-60
Histograms no tableau
http://breaking-bi.blogspot.com.br/2013/05/creating-histograms-in-tableau.html
• TOOLTIPS
Editar Tooltips
http://www.tableausoftware.com/support/knowledge-base/editing-tooltips
Barras nos Tooltips
http://www.tableausoftware.com/public/knowledgebase/barsintooltips
http://www.thedatastudio.co.uk/tag/tooltip
Formatação condicional
• LABELS
Conditional labels
http://www.tableausoftware.com/support/knowledge-base/conditional-data-labels
Map labels
https://www.interworks.com/blogs/rrouse/2014/03/20/one-weird-trick-smarter-map-labels-tableau
Formatando bar charts & gantt charts
http://drawingwithnumbers.artisart.org/wiki/tableau/formatting-bar-charts-and-gantt-charts/
Text-labelled bars: beyond the default
http://interworks.co.uk/andy-cotgreave/text-label-beyond-default/
Conditional Formatting of Measure Names/Measure Values
http://community.tableausoftware.com/ideas/1071
• IMAGENS (CUSTOM SHAPES)
http://inviso.dk/2013/use-images-as-shapes-in-tableau/
tableau assignes images in alphabetical order
http://www.tableau.com/public/blog/2013/10/creating-and-utilizing-custom-shapes-2171
http://www.jewelloree.com/2013/10/30/dealing-with-718-pokemon-shapes-in-tableau/
http://community.tableausoftware.com/ideas/1129
dynamic changes?
http://community.tableau.com/thread/119079
http://community.tableau.com/message/253057#253057
http://www.youtube.com/watch?v=nD0rRq5MUXo
• MAPAS
Padrão LatLong Tableau: Graus Decimais.
Conversor Graus/Min/Seg > Decimais
http://www.tableausoftware.com/support/knowledge-base/convert-latitude-longitude
Latitude e Longitude no Tableau
http://www.add-knowledge.com/?p=76
http://community.tableausoftware.com/thread/107446
API pra pegar LatLong
http://www.add-knowledge.com/maps/
Label control in Maps
http://www.tableausoftware.com/support/forum/topic/controlling-label-display-and-path-coloring-maps
Mapping state by color without losing perspective of population
Linking to Google Maps
http://www.tableausoftware.com/public/knowledgebase/linking-google-maps
Polygon maps, cloropleth, polygon-shaded, shapes...
Cloropleth
http://www.clearlyandsimply.com/clearly_and_simply/2009/10/choropleth-maps-with-tableau.html
PreProcess shapefile for Tableau
Mapas com polígonos
http://www.tableausoftware.com/support/knowledge-base/polygon-shaded-maps
http://www.tableausoftware.com/forum/polygon-files-structures
Mais opções em mapas com polygons
http://www.tableausoftware.com/support/knowledge-base/using-selectable-polygon-features-60
Creating Tableau Polygons from ArcGIS Shapefiles
Método 1 http://www.tableausoftware.com/community/support/kb/tableau-polygons-arcgis-shapefiles
Método 2 http://www.tableausoftware.com/support/forum/topic/map-shapefiles-and-points
http://www.tableausoftware.com/support/forum/topic/data-sharing
Problemas com Polygons no
http://www.tableausoftware.com/support/forum/topic/data-sharing
Polygon map no tableau - outra gambiarra
http://community.tableausoftware.com/message/172773#172773
combinação polygon map + outra coisa
poligonos prontos (tde?)
Data layers
Como funciona
São arquivos TMS, uma série de XMLs.
http://hackyourmap.com/faq.html
Editar arquivo TMS
http://community.tableausoftware.com/thread/121418?start=0&tstart=0
Custom data layers
A princípio não é possível, pois é feito por uma empresa que chama Urban Mapping, que parece cobrar para hospedar dados que o tableau entende.
http://community.tableausoftware.com/thread/105354?start=0&tstart=0
http://community.tableausoftware.com/thread/123578?start=0&tstart=0
Criar um servidor WMS próprio
"If you want custom data layers, you need to use your own WMS server."
Não funciona no tableau public.
http://community.tableausoftware.com/ideas/2099
adicionando outro wms
http://vizwiz.blogspot.com.br/2012/09/embedding-coolest-wms-server-ever-into.html
wms alternativos
http://theywalkedtogether.blogspot.com.br/2014/01/tableaumapping-alternative-background.html
• BACKGROUND IMAGES
http://www.clearlyandsimply.com/clearly_and_simply/2009/09/background-image-maps-with-tableau.html
Problemas com background images
http://kb.tableausoftware.com/articles/knowledgebase/issues-background-images
*é preciso que a base de dados com as coordenadas seja primária
*the longitude and latitude fields need to be continuous dimensions. Then you should put Longitude on the Columns shelf and Latitude on the Rows shelf.
http://community.tableausoftware.com/thread/107446
Plotar pontos em cima de uma imagem qqer
http://www.theinformationlab.co.uk/2011/01/20/bespoke-mapping-in-tableau/
Configurar as coordenadas da imagem
http://kb.tableausoftware.com/articles/knowledgebase/background-image-coordinates
Conditional Background formatting
http://community.tableausoftware.com/thread/107706
(há uma limitação que com os pontos plotados, que em um grid muito pequeno como o diagrama de nolan, os pontos ficam sobrepostos. Ou seja, não posso aplicar alguns efeitos como por exemplo transparência nos pontos, pois ficariam menos transparentes os pontos que tem menos sobreposição) http://community.tableausoftware.com/thread/110884
http://www.theinformationlab.co.uk/2011/01/20/bespoke-mapping-in-tableau/
ajustes basicos
http://vizpainter.com/3-easy-tableau-tips-for-confident-clean-shaven-maps/
http://kb.tableausoftware.com/articles/knowledgebase/mapping-datapoints-google-maps
• FORMATAÇÃO
Gridlines verticais nos gráficos/tabelas
https://community.tableau.com/message/572797
bar charts grid lines can be tuned with "Format > Lines" (or using brush icon on Format Lines tab).
• CORES
Cores personalizadas
http://kb.tableau.com/articles/knowledgebase/creating-custom-color-palettes
http://powertoolsfortableau.com/generate-custom-color-palettes-color-tool-tableau
Color coding / legenda de cores customizada e variável
http://www.tableausoftware.com/support/forum/topic/multiple-colors
…you can only apply one color code to sheet, and the fact that the original data has all SubN measures as separate fields (i.e. they are on the same row for each ID). As there is no way to address the field name in Tableau to handle it differently from other fields on the same sheet with one color code, the data needs to be re-shaped to move each SubN measure into its own row, also known as stacking or un-pivoting (this will make more sense once you dissect the attached workbook and its data source).
http://www.tableausoftware.com/support/forum/topic/changing-color-bar-or-other-mark
Tentando escrever um Calculated Field e aplicar no campo Color:
IF ([Valor] >= 21) THEN "Green" ELSE "Red" END
Preciso conseguir escrever na fórmula o resultado de um filtro do campo [Valor]
http://www.tableausoftware.com/support/forum/topic/capturing-value-quick-filter#comment-38440
http://www.tableausoftware.com/support/forum/topic/changing-color-bar-or-other-mark
http://www.tableausoftware.com/support/forum/topic/computing-revenue-over-total-when-filtered-field
Calculated Field funcionando:
IF [Variavel]=[AbandonoMed] AND [Valor] > 20
THEN "Blue"
ELSE "Green"
END
(AbandonoMed é um parâmetro criado pra apontar pra variável)
1 Color Range, 2 measures
http://www.tableausoftware.com/support/forum/topic/applying-single-color-range-two-measures
Custom presets for color coding / Cor no XML do Tableau (xml hack):
http://www.tableausoftware.com/support/forum/topic/custom-presets-colour-coding
Custom Color coding
Creating Custom Color Palettes
You create your own custom color palettes by modifying the Preferences.tps file; the default location of the file is Documents\My Tableau Repository\Preferences.tps
http://www.tableausoftware.com/support/knowledge-base/creating-custom-color-palettes
Change color based on parameter
http://community.tableausoftware.com/thread/119138
http://stackoverflow.com/questions/5460493/multiple-ifs-for-calculated-field-in-tableau
http://blog.instantcognition.com/tableau/2009/01/07/tableau-tips-building-a-calendar-based-view/
• NULLS e ZEROS
Null Values
http://www.tableausoftware.com/support/knowledge-base/null-values
• FILTROS
Filtros dinâmicos
http://www.tableausoftware.com/support/knowledge-base/dynamicmeasures
http://www.tableausoftware.com/support/knowledge-base/measure-names-and-measure-values-explained
Conditional Filters / logarithmic scale
http://www.tableausoftware.com/support/forum/topic/dynamically-hide-items-color-shelf
Global Filters (se aplicam a todos os dashboards. pra aplicar em apenas alguns, usar filter action)
http://www.tableausoftware.com/support/forum/topic/filter-set-global-ability-questions
Filter action. Boa opção para não usar global filter.
http://www.tableausoftware.com/support/knowledge-base/creating-filter-actions-dashboards
Filtrando, shapes mudam de tamanho
http://community.tableausoftware.com/thread/104553
if you use default-assigned shapes, they will shift around,
BUT: if you double-click the shape legend and manually assign shapes, those should stick and stay put even when things are excluded.
Resetar filtros, botão Reset
http://community.tableausoftware.com/ideas/2392
Tem um botão revert all no tableau publicado. Daria pra falar pra pessoa clicar nele.
http://onlinehelp.tableausoftware.com/v7.0/server/en-us/filter_revert.htm
Sort quick filter
Para criar uma ordem personalizada nos itens de um Quick filter tem que editar as propriedades do campo (sendo ele uma Dimension).
Botão direito no campo > Default properties > Sort.
Qualquer configuração editada no Default properties se alteram em qualquer Sheet onde o campo estiver sendo usado.
http://community.tableausoftware.com/thread/105518
Filtros no dashboard (linkar tabela e mapa, por ex)
http://kb.tableausoftware.com/articles/knowledgebase/combining-sheet-links-and-dashboards
Null values - no quick filter
Acontece quando o campo que está sendo filtrado é de uma base de dados secundária (ícone amarelo). É só fazer uma sheet nova começando pela base que contém o campo a ser filtrado, para que ela seja a base primária (ícone azul).
http://kb.tableausoftware.com/articles/howto/hiding-null-values-from-quick-filters
Filtros que não funcionam “apply to all worksheets”
Certain filters you can't do "apply to worksheets" with.
Table calcs is a common one.
Measure Names is another.
Parameter is one way to create global filter when all else fail.
The solution is as follows:
1.Create a parameter: 3Measures
It includes a list of 3 strings:
Total Population
Percent below Federal Poverty Level
Median Household Income
2.Create a calculated field: ParaMeasure
Case 3Measures
When "Total Population" Then Sum(Total Population)
When "Percent below Federal Poverty Level" Then Sum(Percent below Federal Poverty Level)
When "Median Household Income" Then Sum(Median Household Income)
End
3.Use ParaMeasure for Color and Label/Text shelves
Do not use Measure Names or Values
4.Show Parameter Control
https://community.tableau.com/thread/179757
• BASES DE DADOS:
DATA SOURCES, CONNECTIONS, BLENDING
Join or Blend data?
http://kb.tableausoftware.com/articles/knowledgebase/join-vs-relationship-60
Data Blending (é o equivalente a usar VLOOKUP no Excel)
http://www.theinformationlab.co.uk/2012/05/15/tableau-for-excel-users-part-3-data-blending/
padding and working with null values
http://drawingwithnumbers.artisart.org/wiki/tableau/padding-and-working-with-null-or-missing-values/
Overlapping Text
http://onlinehelp.tableausoftware.com/v7.0/public/online/en-us/help.htm
Calculated Fields
http://www.clearlyandsimply.com/clearly_and_simply/2010/10/calculated-fields-in-tableau.html
Mapa filtrado problemas
(Aparecem Null e * asterisco na lista dos itens filtrados. Mapa desaparece em qqer opção que não o *)
http://www.tableausoftware.com/support/forum/topic/trouble-filtering-map-blended-data
Opções:
1. Mesclar as bases de dados em uma. (última opção. teria que juntar todos xls)
2. Usar um parameter e um calc field na base secundária (the data source with the "Total" value).
3. Deixar a base de dados que não contem os mapas como primária. (não funcionou).
(O que acontece: quando se escolhe um valor diferente do "*", o Tableau se limita a mostrar as cidades que possuem apenas dados para o valor filtrado, que são nenhuma, pois todas as cidades tem dados para todos os valores que se quer filtrar)
http://www.tableausoftware.com/support/forum/topic/quirk-filters-blended-fields
http://www.tableausoftware.com/support/forum/topic/data-blend-producing-unexpected-results
(Pro filtro no dashboard funcionar, a base dos tem que ser como primaria. Pro mapa com polígonos funcionar, a base dos mapas tem que ser como primaria. Logo, não funcionam mapa com polígonos e filtro no dashboard. Ah, só com Multiple Tables)
O polygon map só funciona se a base dos mapas for primária (íconezinho azul - tem que arrastar na sheet por primeiro um campo da base de mapas).
Só dá pra usar Measure Values/Measure names como filtro no workbook se a base que tem as variáveis for primária (íconezinho azul - arrastar primeiro na sheet um dos campos dela)
Filtros de tempo
O play da animação (playback controls) só funciona na versão desktop, ainda não no tableau publicado.
http://community.tableausoftware.com/ideas/1201
http://onlinehelp.tableausoftware.com/v6.1/public/online/en-us/i999715.html
Filtros desaparecem
http://www.tableausoftware.com/public/blog/2014/04/oh-no-my-filter-made-my-stuff-disappear-2432
• VALORES DINÂMICOS
Measure names / values
http://www.tableausoftware.com/support/knowledge-base/measure-names-and-measure-values-explained
Ordenar valores dinamicamente/automaticamente
http://screencast.com/t/abKxOpCSr
Editar o campo que está na shelf Rows: Sort > By Field > Selecionar o campo que está disposto na shelf Columns.
[No caso de querer ordenar valores "Measure Values" ou "Measure Names", há duas opções. O mais fácil é reformatar as tabelas.
(opção 1: reshaping data)
http://www.tableausoftware.com/support/forum/topic/sorting-measurement-values-dynamically
(opção 2: chuncho. data blend e parameter)
Multiple Measures, Same Chart
http://www.tableausoftware.com/support/forum/topic/multiple-measures-same-chart
Renomear measures/alias/values
http://www.tableausoftware.com/support/knowledge-base/rename-measures
Nomes de eixo dinâmicos
http://www.tableausoftware.com/support/forum/topic/dynamic-title-and-axis
• CAMPOS DE TEXTO
Mil/Milhões/Bilhões
Condicionais de valor:
População (milhões):
[População]/1000000
População (milhares):
[População]/1000
Condicional mil/milhões:
IIF([População] > 1000000, [População (milhões)],[População (milhares)])
Condicional de texto:
Condicional (mil/Mi)
IIF([População] > 1000000, 'milhões','mil')
Pra resolver o milhão/milhões:
Condicional (mil/Mi) (rótulos)
IIF([População] > 1000000, [População (milhões) (condicional)],'mil')
População (milhões) (condicional)
IIF([População]<2000000,'milhão','milhões')
O Rótulo fica:
<SOMA(Condicional (mil/Mi))>
<Condicional (mil/Mi) (rótulos)>
IIF ([Valor gasto] > 950000,'milhões','mil')
IIF ([Valor gasto] > 950000,[Valor gasto (R$ milhões)],[Valor gasto (R$ mil)])
OUTRA ESTRATÉGIA
IF SUM([Valor gasto]) > 950000
THEN SUM([Valor gasto (R$ milhões)])
ELSE SUM([Valor gasto (R$ mil)])
END
IF SUM([Valor gasto]) > 950000
THEN "milhão"
ELSEIF SUM([Valor gasto]) > 1950000
THEN "milhões"
ELSE "mil"
END
cabeçalho comum pra todos os dashboards
http://www.tableausoftware.com/support/forum/topic/inserting-footer
http://www.tableausoftware.com/support/forum/topic/print-setup-missing-titlecaption-tab
• Formato de números
dinâmico
Problemas com datas
"Excel stores dates as sequential serial numbers so they can be used in calculations. By default, January 1, 1900 is serial number 1, and January 1, 2008 is serial number 39448 because it is 39,448 days after January 1, 1900."
Solução no caso de anos: ao invés de 2004, entrar com 01/01/2004. Para que apenas o ano seja visível, Format Cells > Custom: aaaa (ou yyyy)
http://www.mrexcel.com/forum/showthread.php?t=10485
http://community.tableausoftware.com/thread/110714
String Calculations
Pega a data e devolve uma string:
DATENAME('month',([Periodo]))
Isso dá: April
Abrevia um texto forçando:
LEFT(DATENAME('month',([Periodo])),3)
Isso dá: Apr
http://kb.tableau.com/articles/knowledgebase/month-abbreviations?lang=pt-br
Problema:
As formatações regionais e de idioma (Locale: português) não funcionam com funções nos Calculated Fields, como DATENAME
http://community.tableau.com/ideas/2792
Resolvido:
Criado um Calculated Field [Periodo-String] para transformar a data [Periodo] em string:
DATENAME('month',[Periodo])
E um outro Calculated Field [Deputado + mês] para fazer as substituições:
[Deputado] + " (" +
CASE [Periodo-String]
WHEN "January" THEN "jan"
WHEN "February" THEN "fev"
WHEN "March" THEN "mar"
WHEN "April" THEN "abr"
WHEN "May" THEN "mai"
WHEN "June" THEN "jun"
WHEN "July" THEN "jul"
WHEN "August" THEN "ago"
WHEN "September" THEN "set"
WHEN "October" THEN "out"
WHEN "November" THEN "nov"
WHEN "December" THEN "dez"
ELSE [Periodo-String]
END +
")"
outros testes:
--------
[Deputado] + " - " + [Periodo-MMM]
REPLACE(STR(DATENAME('month',[Periodo])),"April","Abril") +
REPLACE(STR(DATENAME('month',[Periodo])),"March","Mar")
IF [Periodo-MMM]="April" THEN
REPLACE([Periodo-MMM],"April","Abril")
ELSE ""
END
+
IF [Periodo-MMM]="March" THEN
REPLACE([Periodo-MMM],"March","Mar")
END
[Deputado] + " (" + DATENAME('month',([Periodo])) + ")"
DATEPARSE("yyyy-mm-dd",STR([Periodo]))
http://www.clearlyandsimply.com/clearly_and_simply/2014/06/string-calculations-in-tableau.html
• MARK TYPES
Multiple mark types
Using Multiple Measures: There are lots of different ways to compare multiple measures in a single view. For example, you can create individual axes for each measure or you can blend the two measures to share an axis and finally, you can add dual axes where there are two independent axes layered in the same pane. In any of these cases you can customize the marks for each axis to use multiple mark types and add different levels of detail. Views that have customized marks are called combination charts.
• DASHBOARD
http://kb.tableausoftware.com/articles/knowledgebase/combining-sheet-links-and-dashboards
dashboards, actions, and quick filters
http://community.tableausoftware.com/thread/105322
Clear all filters
http://community.tableausoftware.com/thread/108190
Format multiple text fields on a dashboard
http://community.tableausoftware.com/thread/107843
estilos prontos?
http://powertoolsfortableau.com/tableau-workbooks/workbook-tools/
navegação Story buttons
http://vizpainter.com/never-ending-navigation-buttons-that-deselect-themselves/
http://drawingwithnumbers.artisart.org/