Minhas anotações de Power BI, sobre como fazer métricas específicas, cálculos, formatar tipos de gráfico, resolver problemas de interação nos dashboards e outras dicas que podem ser úteis

Line chart shows gap when there’s no data
(instead of connecting)
Measure = IF ( [Total Sales] = 0, BLANK (), [Total Sales] )
https://stackoverflow.com/questions/55495656/show-0-value-on-line-chart-in-power-bi-for-missing-data
Power Query M language x SQL statements
https://forum.enterprisedna.co/t/advance-query-editor-or-create-view-in-sql/20431
Transformar campo de texto em data
I have a text field that contains year and month only (ex '201801'). How do i create a date field using this text field.
Column = DATE(INT(LEFT([Column1],4)),INT(RIGHT([Column1],2)),1)
Calculations and field parameters
Unfortunately, you cannot use Field Parameters directly in calculations.
You'll have to have something like this:
FP PrevYear =
var pyDates = DateAdd('Datetbl'[Date], -1, YEAR)
return SWITCH( MIN(FP[FP Fields]),
NAMEOF([Sales Measure]), CALCULATE([Sales Measure], pyDates),
NAMEOF([Margin Measure]), CALCULATE([Margin Measure], pyDates),
NAMEOF([Cost Measure]), CALCULATE([Cost Measure], pyDates)
)
https://stackoverflow.com/questions/77557085/how-to-use-calculate-with-field-parameter
Power BI DAX How to Calculate and Filter Based on Dates
https://plainlyresults.com/blog/power-bi-dax-how-to-calculate-and-filter-based-on-dates/
DAX with Dates: The Power Plays
Here are some helpful rules to keep in mind when working with DAX measure calculations.
- Calculations works against data source and not against the visual (such as a table) you're adding them to.
- Measures work independently of one another. This means removing a measure from a table won't impact the calculations of the other measures in the table.
- Filters apply first, then calculations. Unlike Excel, DAX doesn't work on individual cells within tables, but instead works on tables and columns. This means that you'll need to leverage a neat trick with harvesting parameters to reference the value of a cell equivalent in Power BI to create these calculations.
DAX measures work more efficiently than DAX columns because they minimize model size by eliminating the need to add new calculated columns.
https://www.codemag.com/Article/2111051/DAX-with-Dates-The-Power-Plays
Show numbers in Thousands or Millions in same column with the new Dynamic formatting in Power BI
VAR salesMeasure = [Total Sales]
return
SWITCH(TRUE(),
salesMeasure-1000000000000 && salesMeasure< -1000000000, "#,,,.0B",
salesMeasure-1000000000 && salesMeasure< -1000000, "#,,.0M",
salesMeasure> -1000000 && salesMeasure< -1000,"#,.0K",
salesMeasure<100000,"0",
salesMeasure<1000000, "#,.0K",
salesMeasure<1000000000, "#,,.0M",
salesMeasure>=1000000000, "#,,,.0B")
https://www.youtube.com/watch?v=ROyVkQ9vTjc&ab_channel=Curbal
https://curbal.com/curbal-learning-portal/show-data-labels-in-k-or-m-in-the-same-column-dynamic-formatting-in-power-bi
Use DAX to Show Values in any Way You Like! Dynamic Format Strings in Power BI
- create a table:
Unit Unit Format Sort Order
None #,##0 1
Thousands #,##0,. 2
Millions #,##0,,.0 3
Billions #,##0,,,.00 4
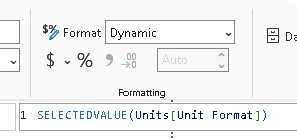
- create a slicer with the “unit” field
- format the field with “Dynamic”
- SELECTEDVALUE(Units[Unit Format])
https://www.youtube.com/watch?v=a3D7oXYjM9k&ab_channel=HowtoPowerBI
Measure = VAR CY2=SUMX(FILTER(ALL('Table'),'Table'[subject]="CY"&&'Table'[date]=SELECTEDVALUE('Table'[date])),'Table'[VALUE])
VAR PY2=SUMX(FILTER(ALL('Table'),'Table'[subject]="PY"&&'Table'[date]=SELECTEDVALUE('Table'[date])),'Table'[VALUE])
RETURN
_PY-_1
CY =
-- Current Year
-- If year is current, Sum of YTD (Year to date) and BOY (Balance of Year)
-- If year is other, sum of sales for all months
IF(
YEAR(MAX('24MonthOutlookVolume'[Date])) = YEAR(TODAY()),
[YTD] + [BOY CY],
[Sales Volume]
)
How to Add a “None” Option to Power BI Field Parameters
https://barneylawrence.com/2022/08/17/how-to-add-a-none-option-to-power-bi-field-parameters/
Chart Legend = {
("None", "None", 0),
("ChannelName", NAMEOF('Channel'[ChannelName]), 1),
("ContinentName", NAMEOF('Geography'[ContinentName]), 2),
("StoreType", NAMEOF('Stores'[StoreType]), 3),
("ProductCategory", NAMEOF('ProductCategory'[ProductCategory]), 4)
}
This option comes with the warning that it’s in no way a supported approach. We’re basically breaking the parameter by making it look for a field that doesn’t exist and there could be consequences I’m not aware of. If you fel this is too much of a risk then stick with option 1.
Organizing - Create a Measures table
https://www.youtube.com/watch?v=pfUXvmcDWeo&ab_channel=phData
https://www.youtube.com/watch?v=cGnWPua-cmo&ab_channel=HowtoPowerBI
Page Navigation buttons
https://community.fabric.microsoft.com/t5/Desktop/Disable-page-navigation-button/td-p/1288229
Active =
SWITCH(
SELECTEDVALUE(’
Ordenar nome dos meses
Go to the database tab, select month name column from your calendar table. Select the modeling tab and then "Sort by Column" and select your month number column. Month name should now appear in the correct order.
https://community.fabric.microsoft.com/t5/Desktop/Month-Name-in-sorting-order/m-p/3163763
https://community.fabric.microsoft.com/t5/Desktop/Two-date-slicers-for-start-and-end-date/td-p/2968815
Criar tabela calendário
https://www.youtube.com/watch?v=UBaW5jwLWsM&t=0s
https://github.com/alisonpezzott/powerbi/blob/main/power-query-m/fxGeraCalendarioAlisonV3
calculate last 12 month rolling average
Sales Vol 3M Avg. =
VAR NumofMonths = 3
VAR LastCurrentDate = MAX('GapAnalysisWKFCSF'[Date])
VAR Period = DATESINPERIOD('Date Table'[Date],LastCurrentDate,-NumofMonths,MONTH)
VAR Result =
CALCULATE(
AVERAGEX(
VALUES('Date Table'[Month Name Short]),
[Sales Vol]
),
Period
)
RETURN
Result
Didnot work
https://www.youtube.com/watch?v=KofI18ZCPOc&ab_channel=LearnAtCloudAnalytics
Sales Vol 3M Avg. =
VAR NumofMonths = 3
VAR RollingSum =
CALCULATE(
SUM(GapAnalysisWKFCSF[Sales Vol&ZCALMTH&-&ZCALMTH2&]),
DATESINPERIOD(GapAnalysisWKFCSF[Date],LASTDATE(GapAnalysisWKFCSF[Date]),-NumofMonths,MONTH)
)
RETURN
RollingSum/NumofMonths
Worked but with pure date (not date hierarchy) and only from dates in the original source (cannot use date from date table)
https://www.youtube.com/watch?v=zYFbr_GsahI&ab_channel=EssentialExcel
Sales Rolling Averag 2 =
DIVIDE (
CALCULATE (
[Sales Vol],
DATESINPERIOD ( 'Date Table'[Date], MAX (GapAnalysisWKFCSF[Date] ), -3, MONTH )
),
CALCULATE (
DISTINCTCOUNT ( 'Date Table'[Month Name] ),
DATESINPERIOD ( 'Date Table'[Date], MAX ( 'Date Table'[Date] ), -3, MONTH )
)
)
WORKED
https://community.fabric.microsoft.com/t5/Desktop/Last-3-months-average/td-p/1569825
dynamic parameter (editar parametro a partir de um filtro)
https://www.youtube.com/watch?v=iiNDq2VrZPY&ab_channel=GuyinaCube
How to Use & Update Parameters in the Power BI Service
Limitation of parameters in PBI:
• Reports can only be published from Power BI desktop, other publishing processes, such as SharePoint/One Drive will not work.
• To modify the parameters in the service, the developer will need admin rights to the gateway on which the source system resides.
https://www.designmind.com/blog/business-intelligence/power-bi-parameters-how-to-use-parameters
Export Measures de um arquivo .pbix
- Abrir arquivo .pbix no Power BI Desktop
- Clicar em Save As
- Clicar em Browse this device
- Escolher tipo do arquivo como .pbit
- Rodar script do PowerShell para extrair as measures
*comigo não funcionou 100%, não veio o conteúdo completo das métricas com mais de uma linha
https://azureops.org/articles/export-measures-from-power-bi/
Como achar o PowerShell:
Uma outra opção mais completa, não testei:
https://www.sqlbi.com/articles/data-model-size-with-vertipaq-analyzer/
mostrar mais de uma dimensão na Matrix
- usar uma tabela desconectada das outras só com o nome e o DAX das métricas
Switch Measure =
SWITCH (
SELECTEDVALUE ( DimMeasure[Measure Name] ),
"Total Autobooked Invoices %", [Total Autobooked Invoices %],
"Total Active Administrations", [Total Active Administrations]
)
misturar meses e quarters:
https://www.youtube.com/watch?v=gv4kCt7vK7U
using measures as columns using calculation group
https://www.youtube.com/watch?v=90X5_tISxIY
to create a Time Intelligence table which contains blocks of rows per period. Some example time-periods might be:
- Current Year
- Prior Year
- Last 2 Months
- Last 3 Weeks
- Last 28 Days
- Year to Date
https://dax.tips/2019/10/09/row-based-time-intelligence/
Botão Calculation Group não aparece

- Abre as preferências
- Preview Features
- Habilitar a opção “Model explorer and Calculation group authoring”

Calculation Groups - 3 usos
https://www.youtube.com/watch?v=ZOOdmUCO3m8
Creating Help Popup
https://www.youtube.com/watch?v=JZ0FwDr9SXU
Bookmark that dont mess up with filters
Normalmente os bookmarks salvam junto a seleção de filtros, prejudicando a interação desejada pra ele (criar um popup ou alguma navegação interna). Para desabilitar isso e permitir que o bookmark não carregue as opções de filtro:
- abra o painel de bookmarks (View > Bookmarks)
- clique nas opções do bookmark (botão direito ou clique no ícone de três pontinhos)
- desmarque a opção “Data”
- pronto. Agora habilitar ou desabilitar o popup não altera os filtros selecionados no dashboard